
Figure 1. The L.M. Gould anchored off of Avian Island near PAL 200.040. A leopard seal and Adelie penguins relax on an ice flow.
February 19th, 2016
By: Carly Moreno
I get a lot of questions about what it’s like to be on a research ship from my family and friends. I’ve been on several research vessels and tall ships, and have spent several months at sea. Like these other vessels, the ARSV Laurence M. Gould is also very comfortable with good food and helpful crew. The LMG is an icebreaker and was built for science and supplying Palmer Station. The lab spaces, radiation vans, and the galley occupy the first deck. The second and third levels are for sleeping, the lounge and gym. Of course the bridge is the highest level, and below the water line is the engine and storage compartments.
Ship life revolves around the science, and this year, the ice conditions. Most of the time it’s a rush to get everything ready and organized for a deployment, then a lot waiting around for the ship to get into position at station or for the wind to blow away the ice. Mostly things go smoothly and there’s enough time to relax at the end of the day and do some crafts or watch a movie. Sometimes, things don’t go smoothly and we’re left troubleshooting equipment for a couple of hours. For my experiments, this means troubleshooting the trace metal tow fish and fixing the mass spectrometer.
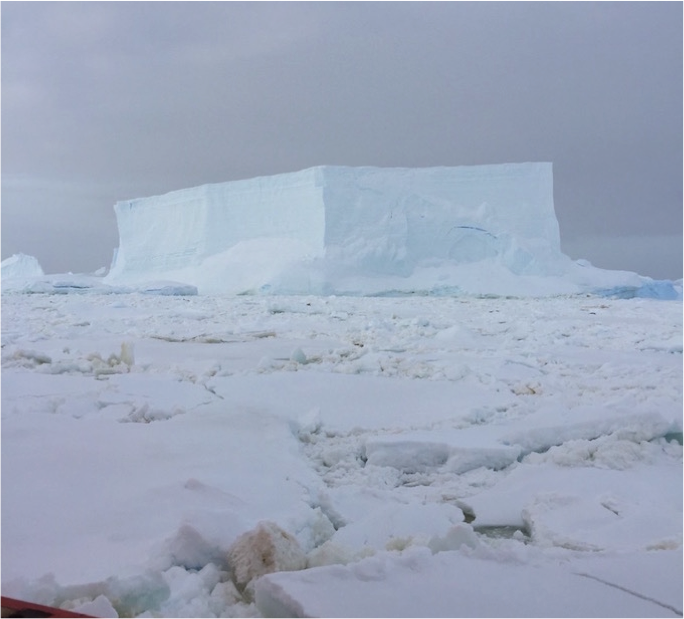
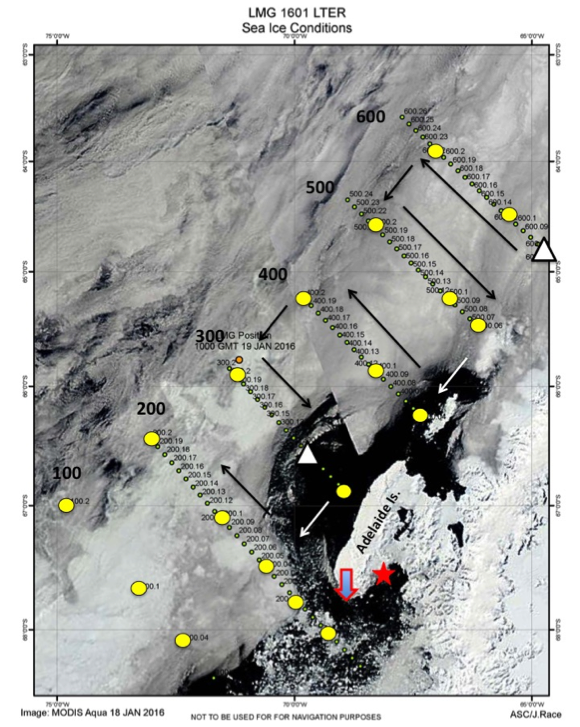
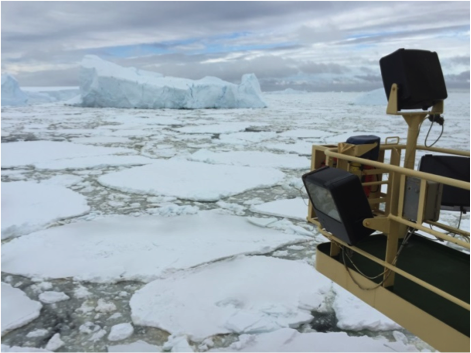
Figure 2. The anomalously large amount of sea ice near the southern grid lines. We were stuck next to this massive iceberg for 12 hours!
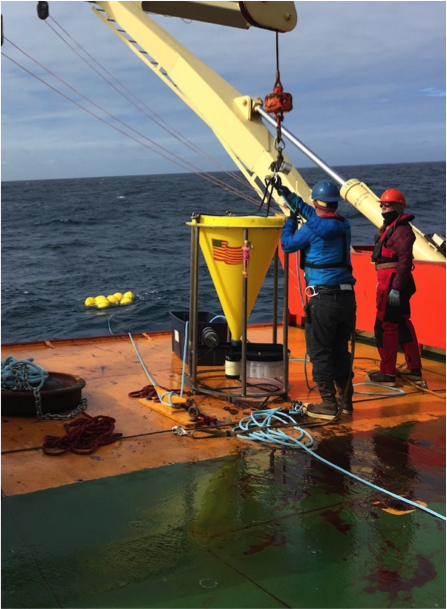
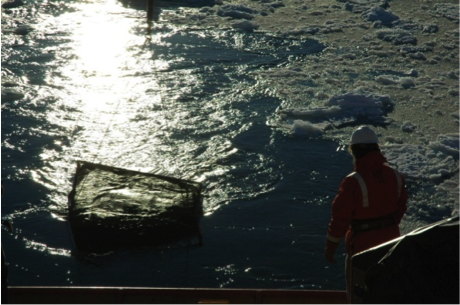
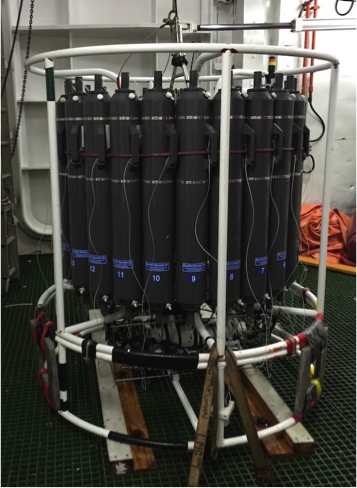
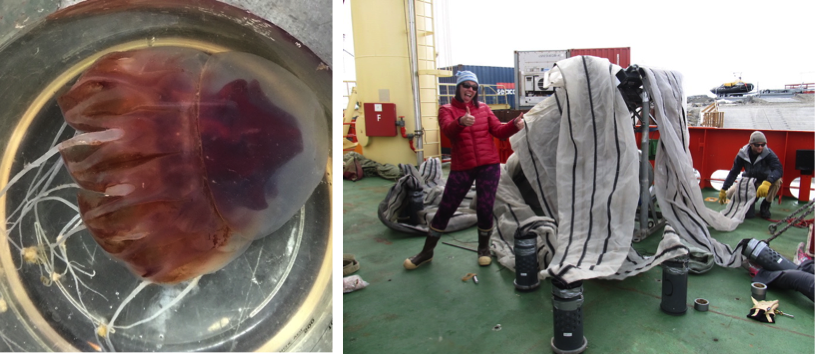
For the underway stations, the ship does not stop, just slows down to a couple of knots, and everyone crowds around the seawater intake valve to take their samples. At the hydrographic stations, we first deploy the optical cast, then the regular CTD, followed by the trace metal CTD, and finally the zooplankton net tows. The whole process takes about 5-7 hours and then we’re onto the next station. We also spend at least 4 solid days of ship time recovering and deploying physical oceanography moorings and sediment traps that are placed near the submarine canyons in Palmer Deep and Marguerite Bay.
The science activities that take place are made possible by the excellent ASC staff and ship’s crew, who are crucial in the success of all shipboard operations. ASC staff are led by Lindsey “Boss Lady” Loughry and are comprised of MT’s who work the deck, and ET’s who help with the electronics for the ship and scientists. A special shout out to ET Alec Chin for helping me with several projects, and to Kate Ruck for helping me ship all of my samples back to UNC. Captain Ernest Stelly has been on the ship for 11 LTER cruises and is very knowledgeable in navigating the ice filled waters. The mates are perhaps the youngest people on the ship, both Rob Depietre and Ladd Olsen are 23 years old, but are quite capable in icy waters. I’m sure they will be captains on their own ships one day.
Meals are early and usually Asian inspired as the cooks are from the Phillippines. Lucky me, I love sinigan soup with lots of rice! They also make delicious deserts, like the tres leches cake with vanilla and orange frosting we had last night! But on long cruises, all the veggies and fruits disappear after about a month. Surprisingly, the food on the ship has been better than the food at either Palmer Station or the British station, Rothera.
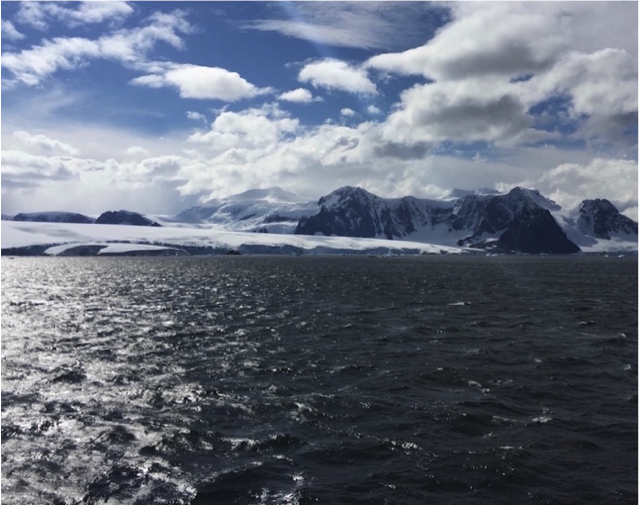
Figure 3. Lemaire Channel between the PAL 400 and 500 lines. This area is also known to have large whale populations.
In my free time, I like to spend as much time on the bridge as possible; that way I can take in all of the amazing scenery and wildlife. The birders and whalers also spend a lot of time on the bridge and I’ve learned quite a lot about the animals that they study. Because of our long transits, we also have time to watch movies and do crafts in the ship’s lounge. I’ve enjoyed learning how to play cribbage and how to crochet hats and mittens.
I would summarize ship life as hard work to get all the science done, but also a lot of fun!


University Operator: (919) 962-2211 | © 2024 The University of North Carolina at Chapel Hill |