November 1, 2018
So perhaps you have been reading about the EXPORTS cruise and have heard about this place called Station P. You are now probably wondering why would NASA fund a mission that includes two research vessels spending over three weeks at this place? Well, to some, Station P (also known as Ocean Station Papa or P26) is simply a point on a map in the middle of the North Pacific Ocean – latitude 50 degrees north, longitude 145 degrees west. But to others it is much more than that.
Historically, in the 1950’s the Canadian weather service established a program to position ships off the west coast of Canada to forecast the incoming weather and sea state conditions. Station P was occupied for six weeks at a time by one of two alternating weatherships. Spending that much time at sea at one location can get …well…boring. So to help pass the time, the crew collected samples and obtained measurements of the ocean. In the early days, these included bathythermograph casts that measured ocean temperatures at various depths. As more sophisticated approaches were developed to measure additional ocean properties, they started collecting samples for analysis of seawater chemistry (salinity, nutrient concentrations, etc.), chlorophyll concentrations (used as a proxy for phytoplankton biomass) and performed the occasional plankton haul to discover what critters called Station P their home. A few decades later, with the development of new satellite technologies that enabled the monitoring of weather conditions from space (thanks NASA!), the weatherships became obsolete, and so the program was discontinued in the early 1980s. But as a result of the decades long time series, what became apparent was the critical need for long term monitoring of the ocean. So the Department of Fisheries and Oceans Canada established the Line P program made up of a transect where Station P is the endpoint. Today the Line P program is one of the longest ongoing oceanographic time series.

Map of the Line P transect, ending at Station P (also known as Ocean Station Papa or P26) in the Northeast Pacific Ocean. Image provided by Karina Giesbrect.
So what’s so special about Station P? Well this mostly depends on who you ask. For one, the North Pacific is one of the largest ocean basins. It undergoes periodic oscillations on approximately decadal timescales that can influence global climate. It also represents the finish line of a long convey belt that transports deep waters from far off regions of the planet that brought to the surface in the North Pacific.
From a biologists perspective (yes, I am a biological oceanographer), Station P also happens to reside in a so-called High Nutrient, Low Chlorophyll (HNLC) region where the growth of phytoplankton is limited by the availability of the micronutrient iron. This is a relatively new discovery, and although evidence for iron limitation in this region dates back to the early 80’s, the most compelling data was obtained in 2002 when Canadian scientists performed a large-scale iron fertilization experiment at Station P. The experiment was named the Subarctic Ecosystem Response to Iron Enrichment Study, or SERIES.
I participated in SERIES as a graduate student while completing my Ph.D at the University of British Columbia. My Ph.D. research focused on pennate diatoms (a type of phytoplankton) of the genus Pseudo-nitzschia that dominate iron-induced blooms in many HNLC regions across the globe.
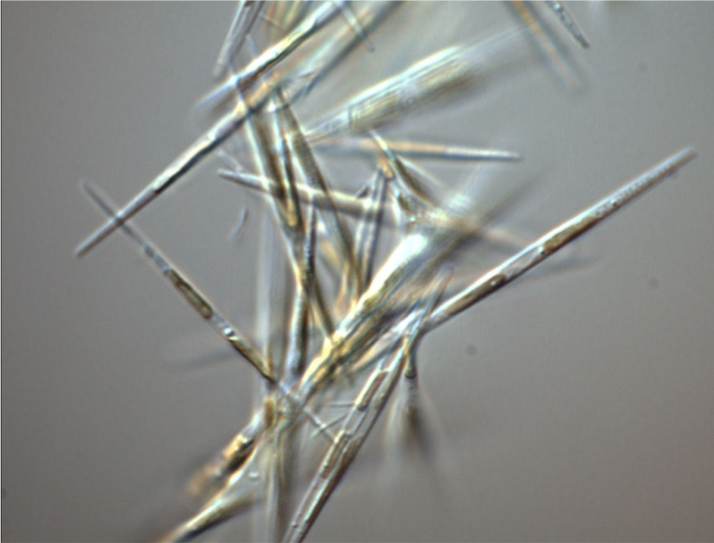
Microscope image of the pennate diatom Pseudo-nitzschia granii. Diatoms like this one are common responders to iron enrichment in many iron-limited regions of the ocean, including Station P. Image courtesy of Adrian Marchetti.
These particular diatoms can achieve rapid growth rates at iron concentrations that would leave their coastal counterparts fully anemic and left for dead. Ferritins, rhodopsins, plastocyanins and flavodoxins…these may mean something to you, or perhaps not. What they tell us is that these oceanic diatoms have many adaptations to survive in low iron waters and sometimes flourish when new inputs of iron periodically enter the ocean, which is primarily from atmospheric dust. Prior to SERIES I joined a number of Line P cruises adding iron to diatoms in bottles to make them blooms. We now know that not all phytoplankton are created equal and given their extensive diversity and important role in contributing to the planet’s carbon cycle, we need to keep studying them.
During the SERIES experiment we also created a massive bloom of diatoms (you guessed it, dominated by Pseudo-nitzschia) as a consequence of adding several tons of iron to an initial patch of seawater approximately eighty square kilometers in size. At the peak of the bloom, the patch had grown to a size of about 700 square kilometers, representing one of the largest experimental manipulations on the planet to date. Fortuitously, the patch was captured by a satellite image of ocean sea surface color at the peak of the bloom, the only such image obtained throughout the entire SERIES experiment. Indeed, the North Pacific Ocean is known for having dense cloud cover almost every day of the year.
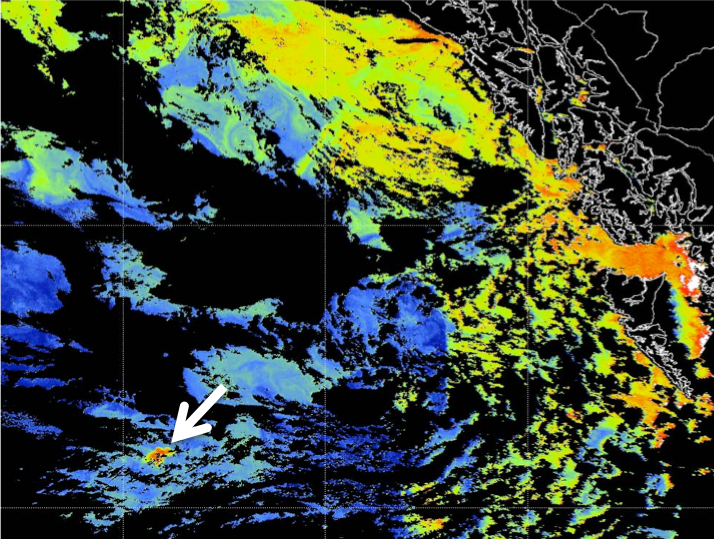
Satellite image from July of 2002 showing surface chlorophyll concentrations in the North Pacific. Warmer colors indicate more chlorophyll. The arrow is pointing to the enhanced chlorophyll concentrations due to a diatom bloom that developed as a result of the SERIES iron enrichment at Station P. Data courtesy NASA SeaWiFS Project. Image provided by Jim Gower, Institute of Ocean Sciences.
So this brings us back to EXPORTS. The EXPORTS cruise marks my seventh trip to Station P, so I am beginning to feel quite at home here. With so many measurements obtained from Station P over the span of almost seven decades, what possibly is there left for us to learn? Well, to put it bluntly…lots! In my career I have been fortunate enough to be participate on a number of field missions and by far the EXPORTS program constitutes one of the most extensive scientific undertakings I have been part of. Although, this time we are not adding iron into the ocean but rather are making observations of it’s natural state by following the same parcel of water that passed through Station P.

Scientist retrieve an instrument that collects ocean optical measurements while aboard the R/V Revelle during the EXPORTS cruise. These optical measurements are similar to those obtained from satellites in space. Image courtesy of Adrian Marchetti
A primary objective of EXPORTS is to quantify the components of the ocean’s biological carbon pump, the process by which organic matter from the surface waters makes it’s way to ocean depths. Scientists on board both ships are measuring the processes that constitute the initial formation of organic matter by phytoplankton all the way to its export from the upper ocean or it’s remineralization back into inorganic carbon – bacteria or little animals known as zooplankton that feed on phytoplankton are both responsible for this process. Other scientists are focused on measuring the fate of the carbon that does sink out of the upper ocean by looking at the overall amount and what forms these sinking particles exist. It’s quite an undertaking that has a lot of moving parts, all happening on two moving ships. There is also a large effort to obtain as much information about this region using a multitude of underway systems that includes mass spectrometers, particle imaging ‘cytobots’ and flow cytometers, autonomous instruments that includes gliders, floats and wire walkers, and instruments that collect optical measurements.
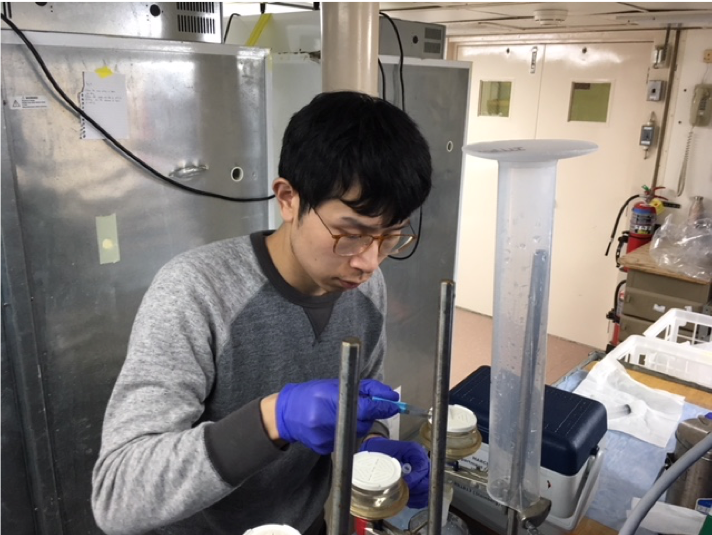
UNC graduate student Weida Gong hard at work collecting phytoplankton on filters aboard the R/V Revelle during the EXPORTS cruise. Image courtesy of Adrian Marchetti.
Although we may consider ourselves lucky if we are able to obtain more than a handful of satellite images of ocean properties from space, we are making similar measurements from the ships. We are also making measurements that do not currently exist on satellites but perhaps one day will so that we can continue to develop new ways of monitoring our precious planet from above.
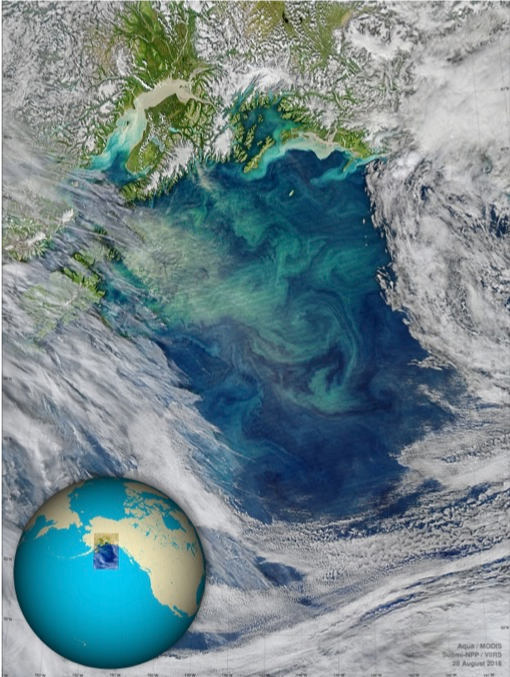
Satellite image of ocean color showing variations in phytoplankton biomass in the Northeast Pacific Ocean (cyan colored swirls). Station P is at the bottom of the image, hidden under the clouds.
Through the years we have learned a lot about how this part of the ocean operates, yet there is still so much more for us to learn. This is especially important at this period in Earth’s history as we continue to place considerable pressures on our valuable ocean resources.
And as for that postcard, well lets just say that it’s in the mail.
University Operator: (919) 962-2211 | © 2024 The University of North Carolina at Chapel Hill |